Using Sandump Tool
- date:
2020-11-10
Starting with OpenSDN Release 2008, Sandump tool is available in contrail-tools container. You can use the Sandump tool on macOS machines.
Sandump tool captures the Sandesh messages from netlink connection between Agent and vRouter (only DPDK mode) and provides interpretation of all the captured bytes.
Starting with OpenSDN Release 2011, you can use Sandump tool on Windows machines.
Sandesh is a southbound interface protocol based on Apache Thrift, to send analytics data such as system logs, object logs, UVEs, and flow logs.
You can analyze the captured bytes in Wireshark. The Wireshark plugin parses the hex dumps of all Sandesh objects. You must use Wireshark Release 3.2 and later.
You must have Wireshark application installed on your machine. You can download Wireshark from the Download Wireshark page.
For more details on Wireshark, see https://www.wireshark.org/docs/.
Follow the procedure to use Sandump tool:
Run the
sandumpcommand. It gives summary of each message which is being transferred between the agent and the vRouter.(vrouter-agent-dpdk)[root]$ ./sandump -hSandump - Sandesh dump utility Usage: ./sandump -w <filename> [filename to write the sandesh packets] ./sandump -c <filename> [force cleanup] (vrouter-agent-dpdk)[root]$Copy the output into a file.
(vrouter-agent-dpdk)[root]$ ./sandump -w <filename>.pcapDumping into <filename>.pcap Running as user "root" and group "root". This could be dangerous. Capturing on 'lo' 12 ^C ./sandump: closing... (vrouter-agent-dpdk)[root]$
The command generates a file which contains sniffed bytes converted in to the pcap format.
Analyze the captured packets transferred between the agent and the vRouter.
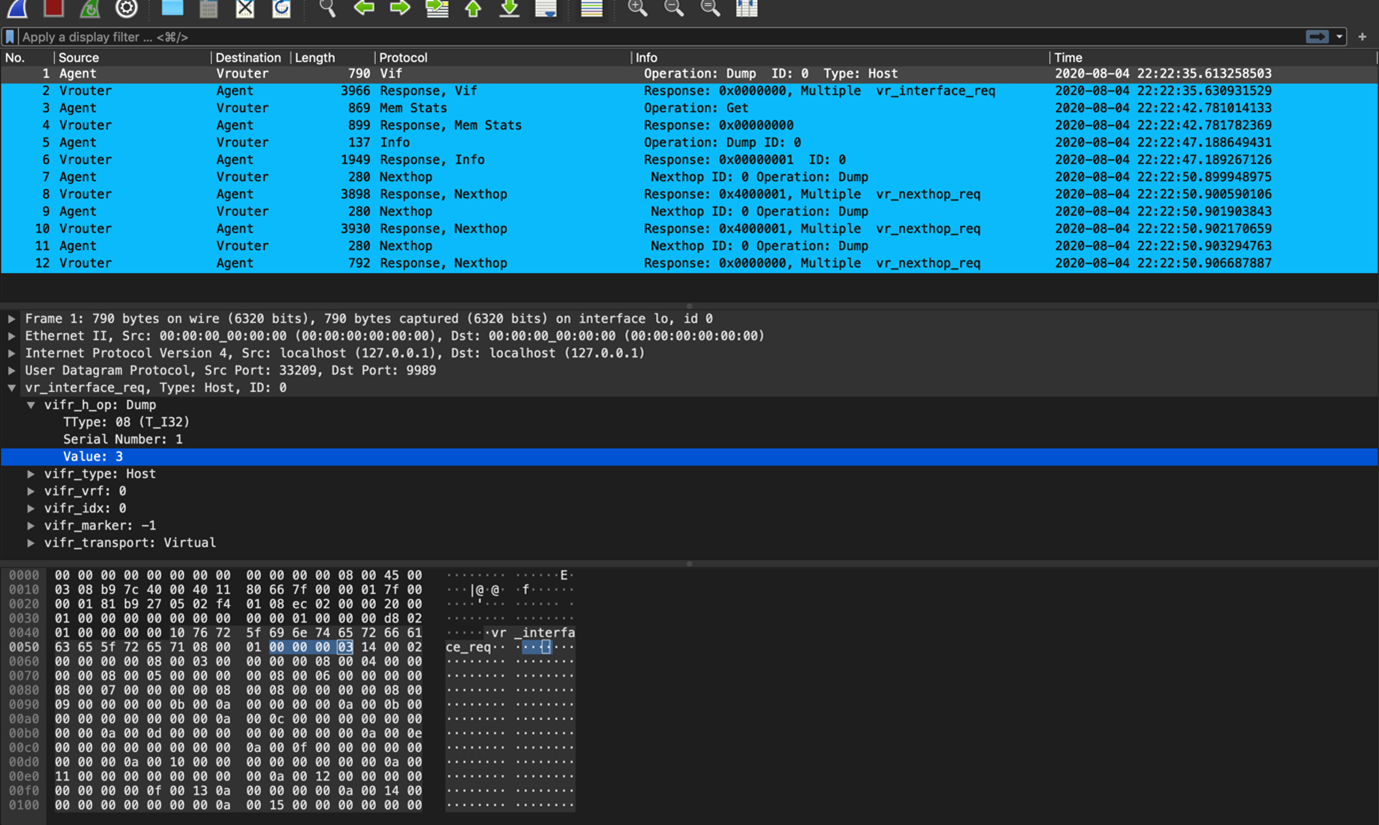
(vrouter-agent-dpdk)[root]$ ./sandumpRunning as user "root" and group "root". This could be dangerous. Capturing on 'lo' 1 2020-08-04 09:51:01.233639252 Agent → Vrouter Vif 790 Operation: Dump Type: Host ID: 0 2 2020-08-04 09:51:01.251279611 Vrouter → Agent Response, Vif 3966 Response: 0x0000000, Multiple vr_interface_req 3 2020-08-04 09:51:33.290323560 Agent → Vrouter Mem Stats 869 Operation: Get 4 2020-08-04 09:51:33.290964111 Vrouter → Agent Response, Mem Stats 899 Response: 0x00000000 5 2020-08-04 09:51:46.175797696 Agent → Vrouter Info 137 ID: 0 Operation: Dump 6 2020-08-04 09:51:46.176494123 Vrouter → Agent Response, Info 1949 Response: 0x00000001 ID: 0 7 2020-08-04 09:51:58.920197081 Agent → Vrouter Nexthop 280 Nexthop ID: 0 Operation: Dump 8 2020-08-04 09:51:58.920905495 Vrouter → Agent Response, Nexthop 3898 Response: 0x4000001, Multiple vr_nexthop_req 9 2020-08-04 09:51:58.922297667 Agent → Vrouter Nexthop 280 Nexthop ID: 0 Operation: Dump 10 2020-08-04 09:51:58.922425514 Vrouter → Agent Response, Nexthop 3930 Response: 0x4000001, Multiple vr_nexthop_req 11 2020-08-04 09:51:58.923525453 Agent → Vrouter Nexthop 280 Nexthop ID: 0 Operation: Dump 12 2020-08-04 09:51:58.926925821 Vrouter → Agent Response, Nexthop 792 Response: 0x0000000, Multiple vr_nexthop_req ^C12 packets captured ./sandump: closing... (vrouter-agent-dpdk)[root]$Analyze the pcap file in WireShark.
Follow the procedure to analyze the packets in Wireshark for Windows OS.
Download the
sandump_wireshark_pluginfolder from the https://github.com/opensdn-io/tf-vrouter/tree/master/utils/sandump repository.Copy the
sandump_wireshark_plugin/main.luafile inC:\Program Files\Wireshark\plugins\folder.Create new lua folder in
C:\Program Files\Wireshark\and copy the rest of the lua files present insandump_wireshark_pluginfolder to the newly created lua folder.Note
Wireshark installation directory for 32-bit Windows is present in
C:\Program Files (x86)\Wireshark\and for 64-bit Windows is present inC:\Program Files\Wireshark\.Run Notepad as administrator and open
C:/Windows/System32/drivers/etc/hostsfile.Add the host names with the following details:
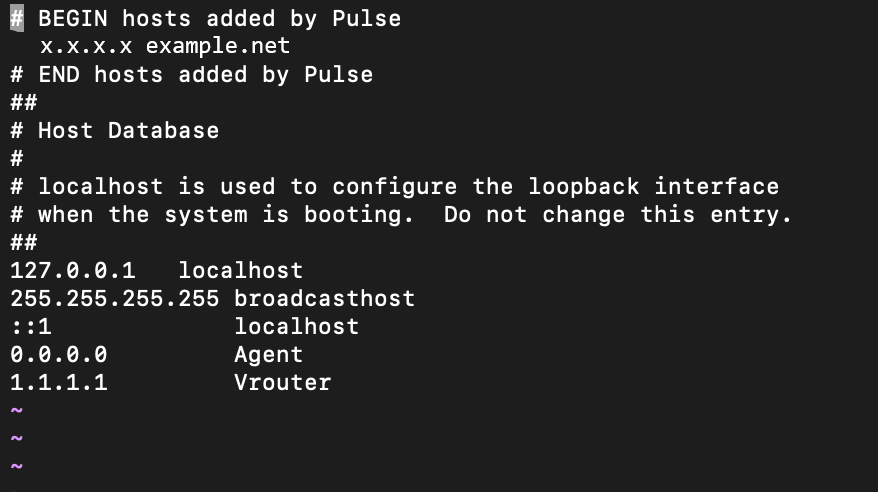
Agent IP address—0.0.0.0
vRouter IP address—1.1.1.1
Figure 1 shows the host file with the required IP addresses.
Open the pcap file generated from Sandump tool for further debugging in Wireshark.
Follow the procedure to analyze the packets in Wireshark for macOS.
Download the
sandump_wireshark_pluginfolder from the https://github.com/opensdn-io/tf-vrouter/tree/master/utils/sandump repository.Copy the
sandump_wireshark_pluginfolder in/Applications/Wireshark.app/Contents/PlugIns/wiresharkdirectory which is also know as Global Lua Plugins directory.Un-comment the
package.prepend_path(…)line in main.lua, common.lua and helpers.lua files found insandump_wireshark_pluginfolder.Navigate to to edit the configuration.
Create hosts file in the Personal configuration directory and add the host names with the following details:
Agent IP address—0.0.0.0
vRouter IP address—1.1.1.1
Figure 3 shows the host file with the required IP addresses.

Navigate to and check Resolve network (IP) addresses option.
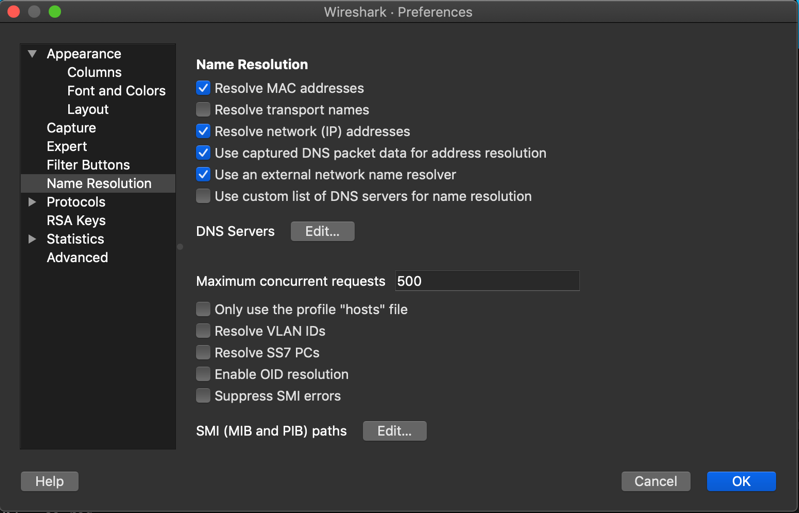
Open the pcap file generated from Sandump tool for further debugging in Wireshark.

Release |
Description |
|---|---|
2011 |
Starting with OpenSDN Release 2011, you can use Sandump tool on Windows machines. |
2008 |
Starting with OpenSDN Release 2008, Sandump tool is available in contrail-tools container. You can use the Sandump tool on macOS machines. |